A think tank producing rigorous, accessible data for advocates, policymakers, & the public.
Clarity and perspective
on state climate policy.

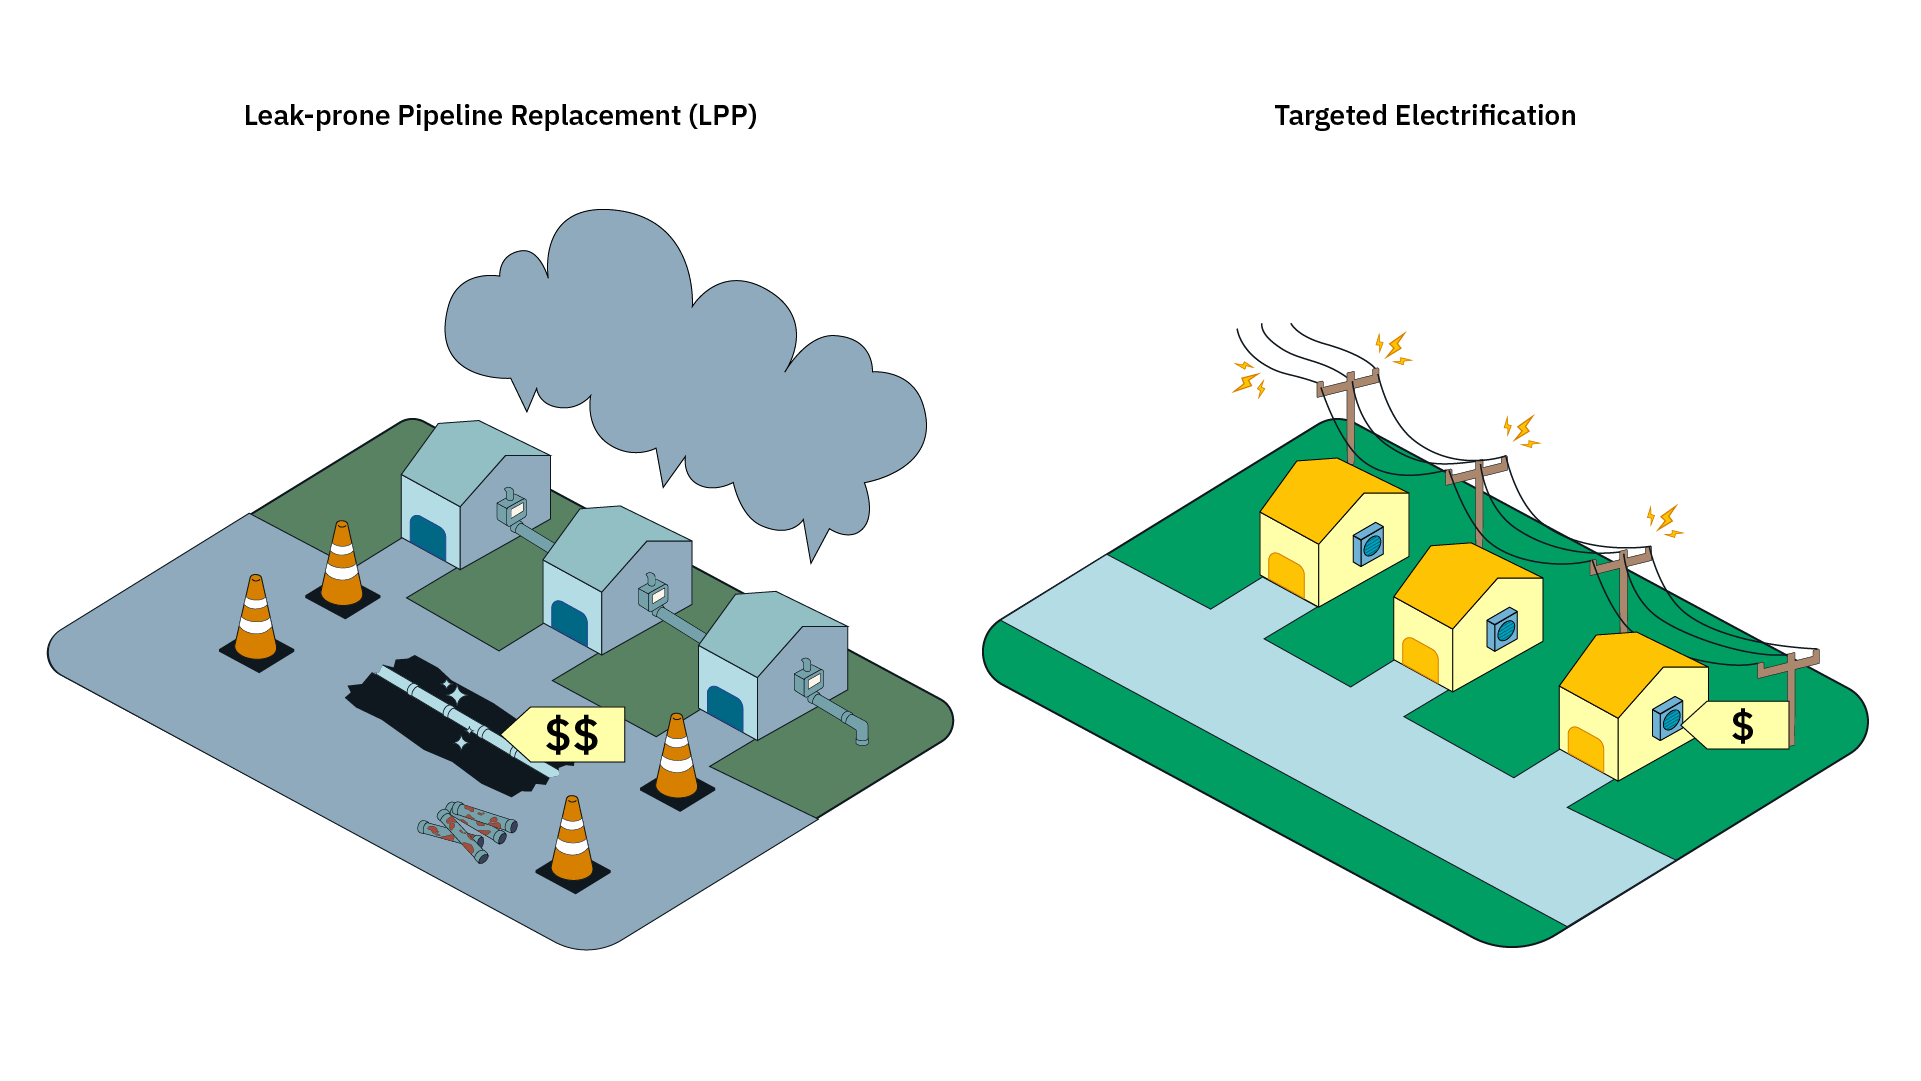
Non-pipeline Alternatives
Conflicting incentives
Gas utility
Who should pay for the electrification?
Electric utility
Residents (NPA)
Public
Conflicting incentives
Gas utility
Who should pay for the electrification?
Electric utility
Residents (NPA)
Public
avoided spending
gas customers/gas usage
ratebase
Conflicting incentives
Gas utility
Who should pay for the electrification?
Electric utility
Residents (NPA)
Public
electric usage
grid upgrade (maybe)
Conflicting incentives
Gas utility
Who should pay for the electrification?
Electric utility
Residents (NPA)
Public
energy bills
(maybe)
new appliances
Conflicting incentives
Gas utility
Who should pay for the electrification?
Electric utility
Residents (NPA)
Public
emissions
energy bills (gas/electric)
\Delta
NPA HOw to PAy
How does who pays for the NPA (and how) impact on utility revenue and consumer affordability.
Opex vs capex
Operating Expense
Recovered immediately in rates
Capital expense
Treated as a long-term asset and added to the rate base
Opex vs capex
$10,000
Rate of Return
Time to recoup
Nominal value recovered
Avg per year
NPV
Opex
None
1 year
$10,000
$10,000
$10,000
Capex
8%
50 years
$30,000
$600
~$7,300
Capex (20yr)
8%
20 years
$18,000
$900
~$9,800
Scenarios
Gas Capex
Gas Opex
Electric Capex
Electric Opex
Taxpayer
Performance Incentive
Business as Usual (No NPA projects)
Performance incentive
NPA Costs Treatment:
NPA costs are treated as Gas OpEx
Collected in the year costs are incurred
No return on NPA investments
Cost Savings:
Savings = NPV(avoided BAU costs) - NPA costs
30% of cost savings are recovered as Gas CapEx over a 10 year period
OUtputs
Utility Revenue Requirement
Volumetric Delivery Tariff
Ratebase
Return on Ratebase as % of Revenue Requirement (Return Component)
Customer Delivery Bill (non-converts and NPA converts)
Sample output
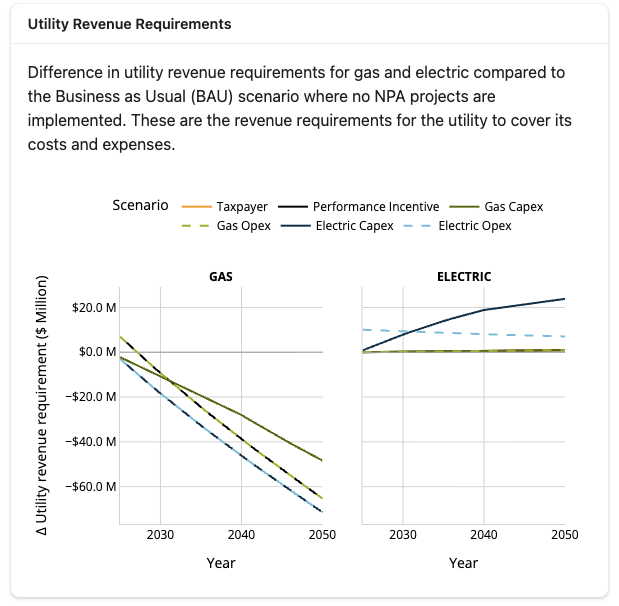
Outcome compared to a world with NO NPAs
Web app
Depreciation treatment
Straight line depreciation
No impairment
Gas Pipeline - 65 years
Electric Grid Upgrades - 55 years
Misc Gas CapEx - 65 years
Misc Electric Capex - 50 years
Revenue requirement
Rev Req = Ratebase x ROR + CapEx + Depreciation Expenses
Grid upgrades
Winter headroom
Summer headroom
Percent of homes with AC (pre-NPA)
peak energy consumption of a household AC unit
peak energy consumption of a household HP unit
Winter peaking
Summer peaking
Volumetric Tariffs
Volumetric Tariff(t) = \frac{Rev. Req(t) - Fixed Charge_{per\_customer} \times N_{customers}(t)}{Useage(t)}
Assumptions
No growth in electric customers, only growth in demand is driven by electrification
Number of gas customers is only reduced by electrification (no price feedback)
We do not account for the role of taxation in the model
NPA HowToPay - NRDC
By Juan-Pablo Velez


